The short answer: there is no single good HRV, only a good number for your age, sex and device
What is a good HRV? A 30 on your app is not automatically low, and a 70 is not automatically great.
What is published is a spread, not a target. A 2010 systematic review pooled short-term recordings from 21,438 healthy adults across 44 studies. Across the 15 studies that reported RMSSD, the mean was 42 ms (SD 15), and the individual study averages ranged from 19 to 75 ms.
Why the spread runs nearly 4x, and the two sources (PMID 20663071, PMC5624990)
That spread runs nearly 4x, and it is the range of study averages, not a normal range for individuals. It is wide partly because it does not sort by age or sex, and the pooled sample includes three large cohorts aged 40 and over, which pulls the average down. Once you do sort by age and sex, a 30 ms reading looks completely different in your 20s than in your 50s.
The rest of this page walks through that sorting: which metric your device actually reports, where your number sits against people your age and sex, what moves it day to day, and how many nights of data you need before comparing anything at all.
Pooled review per Nunan D, Sandercock GR, Brodie DA. A quantitative systematic review of normal values for short-term heart rate variability in healthy adults. Pacing Clin Electrophysiol. 2010;33(11):1407-17, PMID 20663071 (44 studies, n=21,438). RMSSD mean, SD and the range of study averages as reproduced in Table 6 of Shaffer F, Ginsberg JP. An Overview of Heart Rate Variability Metrics and Norms. Front Public Health. 2017;5:258, PMC5624990. Both read Sep 7, 2026.
What HRV actually measures: RMSSD vs SDNN, and why the two are not comparable
"HRV" is not one measurement. It is a family of ways to describe how much the gap between heartbeats varies, and the two you will actually meet on a consumer device measure different things.
RMSSD and SDNN defined, and what Apple Watch, Garmin, Oura and WHOOP each document about their reading
| Wearable | What its own documentation says about the metric | When it takes the reading |
|---|---|---|
| Apple Watch | SDNN: "HealthKit uses SDNN heart rate variability, which uses the standard deviation of the inter-beat (RR) intervals between normal heartbeats" | "The system automatically records samples on Apple Watch" |
| Garmin | RMSSD is the measure its HRV Status page explains: "RMSSD is a standard statistical measure of HRV" | "Continuously while you are sleeping"; the app shows a 7-day average of overnight values |
| Oura Ring | Formula not named on the support article we read | "Only during sleep"; five-minute samples through the night, shown as their average |
| WHOOP | Formula not named on the page we read | "During your deepest sleep each night" |
This is the single most common source of "why does my number look wrong" confusion between two people, or two devices on the same wrist over time. If your partner's Oura says 65 and your Apple Watch says 65, one is a sleep-only average of five-minute samples and the other is an SDNN sample recorded automatically through the day. You are not looking at the same measurement, and neither number is more "correct."
Apple Developer Documentation, HKQuantityTypeIdentifier.heartRateVariabilitySDNN; Garmin, HRV Status page (garmin.com, Garmin Technology, Health Science); Oura support article "Heart Rate Variability (HRV)"; WHOOP, "What is a good HRV" (thelocker). All read Sep 7, 2026. Fitbit's help page could not be retrieved on that date, so Fitbit is not in the table.
Normal HRV ranges by age and sex: where your own number sits
The 13,943-person Dutch reference study, its own wording on the decline, and the two patterns across the bands
The most detailed public reference we found is a 2018 study in Frontiers in Physiology that measured heart-rate-corrected HRV from 10-second ECGs in 13,943 cardiologically healthy people from five Dutch population studies, aged 11 days to 91 years, split into age bands and by sex.
One caveat before the table: these are 10-second ECG values, corrected for heart rate, from a different recording length than the short-term recordings behind the 42 ms average above, so do not read them as a literal stand-in for your ring's overnight figure. Use this table for the shape of the decline and the gap between men and women.
| Age band | Median RMSSD, men | Median RMSSD, women |
|---|---|---|
| 20s | 51.9 ms | 63.7 ms |
| 30s | 37.7 ms | 47.7 ms |
| 40s | 29.9 ms | 35.8 ms |
| 50s | 24.1 ms | 27.3 ms |
| 60s | 20.7 ms | 22.6 ms |
| 70s | 19.0 ms | 20.3 ms |
What the authors say about the decline, and the two patterns across the adult bands
"The median and LLN [lower limit of normal] of both markers steadily decrease from childhood to the years of middle and older age."
van den Berg et al., Frontiers in Physiology, 2018Two patterns hold across the adult bands. The women's median sits above the men's in every band, a difference the authors describe as small but, mostly, statistically significant for the median in the 20 to 70 age groups. And the biggest single-decade drop is from the 20s to the 30s: 14.2 ms for men and 16.0 ms for women at the median. Every decade after that loses less ground than the one before it.
Table 4, heart-rate-corrected RMSSD by age group and sex, per van den Berg ME, Rijnbeek PR, Niemeijer MN, et al. Normal Values of Corrected Heart-Rate Variability in 10-Second Electrocardiograms for All Ages. Front Physiol. 2018;9:424, PMID 29755366, PMC5934689 (n=13,943), read Sep 7, 2026.
Why your HRV is lower than your friend's: six factors that move the number
Age and sex explain the population-level pattern above. Day to day, five other things move your own number. Each row below has a published figure attached, but the figures are not the same kind of evidence: one is a 4,098-person within-subject comparison, one is a pooled effect size from four trials, and one is a single athlete.
The six factors with their published figures (age, alcohol, sleep loss, illness, breathing rate, fitness), how much weight each carries, and the sources
| Factor | Published effect on HRV | Source |
|---|---|---|
| Age, decade to decade | Steepest drop from the 20s to the 30s: 14.2 ms for men and 16.0 ms for women at the median; each later decade loses less | van den Berg 2018, n=13,943 |
| Alcohol, same night | RMSSD in the first 3 hours of sleep down 2.0 ms after low intake (up to 0.25 g/kg), 5.7 ms after moderate, 12.9 ms after high intake (over 0.75 g/kg), vs. the same person's alcohol-free nights; an HRV-derived recovery score fell 9.3, 24.0 and 39.2 percentage units | Pietilä 2018, n=4,098 |
| Sleep deprivation | A small but significant drop in RMSSD (SMD -0.24, 95% CI -0.47 to -0.00), pooled from 4 trials (131 sleep-deprived vs 152 controls) inside an 11-trial, 549-person meta-analysis; SDNN did not change significantly | Zhang 2025, Frontiers in Neurology |
| Acute illness | In one closely tracked case, standing RMSSD fell from 20.8 ms to 4.2 ms over a 6-day upper respiratory tract infection and was back to 21.0 ms afterwards; supine RMSSD did not change significantly | Hottenrott 2021, n=1, elite marathon runner |
| Breathing rate, paced slow | About 26 to 28 ms higher during a 6-breaths-per-minute session (5, 10, 15 or 20 minutes, all alike) vs. the pre-session value; immediately afterwards the breathing conditions no longer differed from the control session, and the authors report only a tendency for the post value to sit above the pre value | You, Laborde 2021, n=59 |
| Fitness / VO2max | VO2max correlated with rMSSD at rho = 0.122 (p = 0.032) in 311 people at high cardiovascular risk without a diagnosis: a real but weak association, not a fitness formula | Cilli Hayıroğlu 2026, n=311 |
Read that table as directional, not as a formula you can add up. The alcohol and age rows are large-sample; the sleep row is a pooled effect size, not a millisecond figure; the illness row is one athlete; the fitness row is a weak correlation in a high-risk clinic population. Four of the six rows agree on the direction: less alcohol, more sleep and slower breathing all point the same way, and a virus can knock the number down hard for a week. Conditioning is the row that does not join them: what sits in this table for it is a weak cross-sectional correlation, while the pooled randomised evidence on exercise training, which our vagus nerve exercises page prints in full with its effect sizes, found no significant change in RMSSD, the vagal marker most of this table is built on. Treat better conditioning as worth doing on its own merits, not as a documented lever on this number.
Alcohol figures per Pietilä J, Helander E, Korhonen I, Myllymäki T, Kujala UM, Lindholm H. Acute Effect of Alcohol Intake on Cardiovascular Autonomic Regulation During the First Hours of Sleep in a Large Real-World Sample of Finnish Employees: Observational Study. JMIR Ment Health. 2018;5(1):e23, PMC5878366 (n=4,098, within-subject comparison of each participant's days with and without alcohol). Sleep-deprivation effect per Zhang S, Niu X, et al. Effects of sleep deprivation on heart rate variability: a systematic review and meta-analysis. Front Neurol. 2025;16:1556784, PMID 40895095, PMC12394884 (11 studies, 549 participants; RMSSD pooled from 4 studies, 131 vs 152). Illness case per Hottenrott L, Gronwald T, Hottenrott K, Wiewelhove T, Ferrauti A. Utilizing Heart Rate Variability for Coaching Athletes During and After Viral Infection: A Case Report in an Elite Endurance Athlete. Front Sports Act Living. 2021;3:612782, PMID 34541520, PMC8446376 (n=1). Breathing figures per You M, Laborde S, et al. Single Slow-Paced Breathing Session at Six Cycles per Minute: Investigation of Dose-Response Relationship on Cardiac Vagal Activity. Int J Environ Res Public Health. 2021;18, PMID 34886206, PMC8656666 (n=59, Tables 1 and 2). Fitness correlation per Cilli Hayıroğlu S, Uzun M. The Relationship Between VO2 Max and Heart Rate Variability Parameters in Individuals with High Risk for Cardiovascular Disease. Acta Cardiol Sin. 2026;42(2):269-277, PMID 41907039 (n=311, retrospective). All read Sep 7, 2026.
How to read your own baseline: the rolling average, the overnight rule, and how long it takes
A single day's number is mostly noise. The signal is your own trend, read the way the device makers themselves document it.
The three steps: a 7-day rolling average, an overnight reading, and about three weeks before comparing
Use a 7-day rolling average
Garmin's HRV Status, for one, is built on your 7-day average of overnight HRV, compared against your personal baseline range. Averaging a week smooths out the swing a single bad night or one drink can cause.
Read it at a comparable moment
Overnight readings compare you at a similar physiological state, before caffeine, food, exercise or the day's stress. That is why Oura measures HRV only during sleep, WHOOP during your deepest sleep, and Garmin continuously while you are sleeping.
Give it about three weeks first
Garmin's own page says you need to wear the device overnight for around three weeks before its HRV status becomes fully active. That is the closest thing to a published baseline window we found, and a sensible floor on any device before a comparison against your own baseline means anything.
None of this replaces the age-and-sex table above. It answers a different question: not "is my number normal for my demographic," but "is today's number normal for me."
Sources for the three steps
Rolling-average and baseline-window statements per Garmin's HRV Status page; reading windows per Oura's support article "Heart Rate Variability (HRV)" and WHOOP's "What is a good HRV" page. All read Sep 7, 2026.
HRV and the vagus nerve: what a high or low number says, and what it does not diagnose
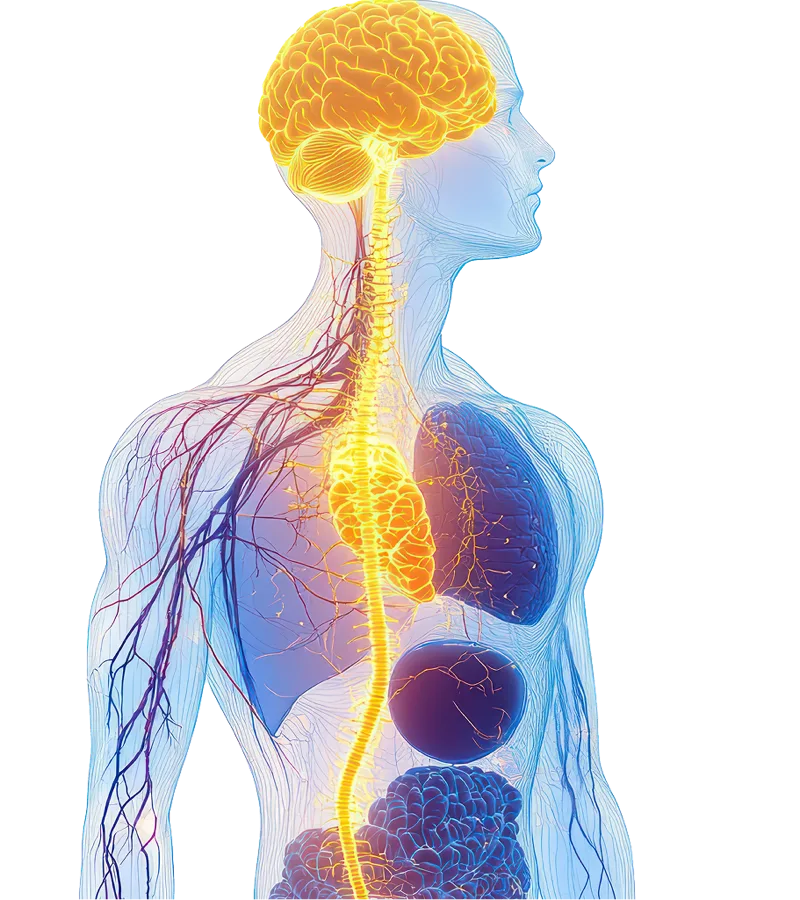
What the vagus nerve is, and why RMSSD is read as a proxy for it
Your vagus nerve is the main channel of the parasympathetic nervous system, the "rest and digest" side of your autonomic nervous system. RMSSD, in particular, is treated as a proxy for how strongly that side is influencing your heart rate right now: Shaffer and Ginsberg describe it as the primary time-domain measure used to estimate the vagally mediated changes reflected in HRV.
A higher RMSSD generally means more vagal influence on your heart rate in that window. A lower one generally means the sympathetic, "fight or flight" side has more relative pull.
What it does not do: diagnose anxiety, heart disease, poor fitness, or any specific condition on its own. HRV is one signal among many your body produces, shaped by everything in the six-factor table above, not a single dial for "how stressed are you."
Source for the vagal-tone framing
Vagal-tone framing per Shaffer F, Ginsberg JP. An Overview of Heart Rate Variability Metrics and Norms. Front Public Health. 2017;5:258, PMC5624990, read Sep 7, 2026.
Three signals worth noticing, and what each usually reflects
None of the following is a clinical cutoff. They are the heuristics the device documentation and the reference data above actually support.
The three signals: a 7-day average outside your own range, a week-long trend, a reading under about 20 ms
Garmin's HRV Status flags a 7-day average that falls outside your personal baseline range as unbalanced. That is the shape to watch on any device: not one low morning, but a rolling average that sits below your own range and stays there.
Usually reflects heavier training load, poor sleep, an incoming illness, or a real stressor, not a fixed diagnosis.
One rough night moves the number for a night. A full week where daily readings sit under your rolling average is a different, more meaningful signal than any single low morning inside otherwise normal noise.
In the age-and-sex table above, a median near or under 20 ms is what a healthy population in its 60s and 70s looks like (19.0 to 20.7 ms for men, 20.3 to 22.6 ms for women). Seeing that number in your 20s, 30s or 40s puts you well below your own age band's median.
These are wellness heuristics, not medical thresholds
All three come from device-maker documentation and the population reference data cited on this page, not a clinical cutoff for any disease.
- A low reading with no other symptoms is usually noise, training load, or a bad night, per the six-factor table above.
- A persistently low reading alongside other symptoms, such as fatigue, palpitations, or a rising resting heart rate, is worth bringing to a doctor.
- Nothing on this page is a substitute for medical advice, and HRV trackers are general wellness tools, not diagnostic devices.
What a device-based nudge to the vagus nerve can and cannot do to the number
If your own trend keeps landing below baseline, sleep and training-load changes are the well-established levers. Some wearable owners also look at neck-worn devices designed to stimulate the vagus nerve directly, using transcutaneous vagus nerve stimulation, tVNS, rather than only waiting on lifestyle changes to move the number.
No independent study covers the device we reviewed: what the tVNS research does and does not test
The honest evidence line: no independent peer-reviewed study covers the device we reviewed, and the tVNS research that does exist is published on the technique itself, in lab settings. A study on transcutaneous stimulation and heart-rate variability outcomes tests electrode placement, pulse pattern and session length that a lab controls; it does not test one specific product's firmware or session design. None of the studies cited on this page measured a named consumer device's own before-and-after RMSSD or SDNN.
What a short session can plausibly do is narrower than the marketing suggests, and narrower than the paced-breathing row above. When 16 sham-controlled studies of ear-clip tVNS in healthy adults were pooled, acute stimulation did not alter vagally mediated HRV at all, a result our does vagus nerve stimulation work page prints in full with its effect size; no pooled analysis we could verify covers a neck-worn device on this measure either way. Treat a session as a relaxation ritual you are testing on your own trend, not as a measured lever on the number. What it cannot do: treat, cure, prevent or reverse a chronically low HRV, or replace sleep, training-load management and the other factors this page actually documents with numbers.
Where we priced that exact case, and read the research behind it
If your morning HRV keeps landing under your baseline and you want a hands-off way to nudge the parasympathetic side, we priced the 4-minute neck wearable and read its claims against the tVNS research in our Pulsetto Fit review, which is a desk review: we have not worn the device ourselves, and the review says so.
What the review covers, and two tips before buying any vagus-nerve wearable
That review reads the device's own claims the same way this page reads RMSSD against SDNN: what the mechanism-level studies actually cover, what the manufacturer says on its own store pages, and what a 4.2-out-of-5 independent Trustpilot rating from 3,415 reviewers does and does not tell you.
Build your own baseline first, on whichever device you already own, over the three weeks or so that the device documentation above describes. A device can only meaningfully move a number you have actually measured against yourself.
Treat any vagus-nerve wearable as a relaxation aid you are testing on your own trend, not a guaranteed fix. The 30-day money-back window Pulsetto publishes is the honest way to find out if it moves your number at all.
What tVNS research actually covers, the real year-one cost, and the honest verdict.
Questions people also ask
Is an HRV of 30 good or bad?
Neither, on its own. In a 44-study review of short-term recordings from 21,438 healthy adults, RMSSD averaged 42 ms and the individual study averages ranged from 19 to 75 ms, so 30 ms sits inside that spread, below the average. Age-and-sex reference values from a separate 13,943-person, heart-rate-corrected, 10-second ECG study put the median RMSSD at 29.9 ms for men in their 40s and 27.3 ms for women in their 50s, so 30 ms reads as unremarkable in midlife and low for someone in their 20s. The number only becomes meaningful next to your own age band and your own trend over time.
Does HRV go down with age?
Yes. In the 13,943-person reference study published in Frontiers in Physiology (2018), median RMSSD fell in every adult decade measured, from 51.9 ms (men) and 63.7 ms (women) in the 20s down to 19.0 ms and 20.3 ms respectively in the 70s. The steepest single-decade drop was from the 20s to the 30s; each decade after that lost less than the one before it.
Why is my HRV different on Apple Watch and Oura?
Because the two are not measuring the same thing at the same time. Apple's HealthKit documentation says it uses SDNN, the standard deviation of the intervals between normal heartbeats, and that Apple Watch records samples automatically. Oura's support documentation says it measures HRV only during sleep, taking five-minute samples through the night and showing you their average. A daytime SDNN sample and a sleep-only average are two different measurements, so a 35 ms reading on one and a 35 ms reading on the other are not describing the same thing. Track the trend on one device, not the raw number across two.
Can you have too high an HRV?
Not in the sense of a healthy person being penalized for a high number: a higher RMSSD generally reflects stronger parasympathetic, vagal influence on your heart rate, which is the direction wellness guidance points toward, not away from. Two honest exceptions: the Shaffer and Ginsberg review notes that ECG morphology can reveal whether elevated HRV values are due to problems like atrial fibrillation, so a sudden unexplained spike alongside symptoms like palpitations is worth a doctor's opinion rather than celebration; and chasing an ever-higher number instead of a stable one relative to your own baseline is not what the research measures success by.
How we built this page
This is a literature-and-documentation page, not a lab test of any device.
Every number on it comes from a named, dated source, and every study figure was checked against the source's own abstract or full text on Sep 7, 2026. Eight peer-reviewed sources are named and cited here. Two further pooled results are referenced in a single line each, without an author or an effect size, because they are printed in full on the sibling pages linked beside them.
Every source, PMID and read date behind this page, and what we did not test
- The pooled short-term review (44 studies, n=21,438) is Nunan D, Sandercock GR, Brodie DA, Pacing Clin Electrophysiol, 2010, PMID 20663071. Its RMSSD mean of 42 ms (SD 15) and the 19 to 75 ms range of study averages are taken from Table 6 of Shaffer F, Ginsberg JP, Front Public Health, 2017;5:258, PMC5624990, which reproduces Nunan's norms and notes the three large cohorts aged 40 and over.
- The age-and-sex table (n=13,943) is Table 4 of van den Berg ME, et al., Front Physiol, 2018;9:424, PMID 29755366, PMC5934689. The sex-difference wording follows the authors' own ("small, but statistically significant" for the median in the 20 to 70 age groups).
- The RMSSD and SDNN definitions, the vagal-tone framing and the atrial-fibrillation caution are from Shaffer F, Ginsberg JP, 2017, as above.
- The alcohol figures (n=4,098) are from Pietilä J, et al., JMIR Ment Health, 2018;5(1):e23, PMC5878366.
- The sleep-deprivation effect (SMD -0.24, 4 trials, 131 vs 152, inside an 11-study, 549-person meta-analysis) is from Zhang S, et al., Front Neurol, 2025;16:1556784, PMID 40895095, PMC12394884.
- The illness case (n=1) is from Hottenrott L, et al., Front Sports Act Living, 2021;3:612782, PMID 34541520, PMC8446376.
- The breathing-rate figures (n=59) are from You M, Laborde S, et al., Int J Environ Res Public Health, 2021, PMID 34886206, PMC8656666, Tables 1 and 2.
- The fitness correlation (n=311) is from Cilli Hayıroğlu S, Uzun M, Acta Cardiol Sin, 2026;42(2):269-277, PMID 41907039.
- The device-metric table, the 7-day average and the three-week window are from Apple's HealthKit documentation for heartRateVariabilitySDNN, Garmin's HRV Status page, Oura's support article on HRV, and WHOOP's "What is a good HRV" page, all read Sep 7, 2026. Fitbit's help page and WHOOP's separate HRV explainer could not be retrieved that day, so no metric is printed for Fitbit and no formula is printed for Oura or WHOOP.
- Pulsetto Fit facts referenced in the bridge section (the 4-minute session, the 30-day money-back window, the Trustpilot 4.2 rating from 3,415 reviews as read Aug 26, 2026) come from our own recon file and our published review at /pulsetto-fit-review/.
- The two cross-referenced pooled results are not counted among the eight above, because their full citations sit on the pages linked next to them: the 16-study ear-clip tVNS null on vagally mediated HRV is printed with authors, PMID and effect size at /does-vagus-nerve-stimulation-work/, and the 34-trial exercise-training null on RMSSD at /vagus-nerve-exercises/. Both source passages were re-read on Sep 7, 2026 and are filed verbatim in this page's provenance ledger.
- We did not test any wearable's accuracy ourselves, we have not worn the device our review covers, and we did not estimate a number for anything we could not source.
- Nothing here is medical advice. Persistent low HRV alongside other symptoms, or any new heart-related concern, is a conversation with your doctor first.